

Projects
Case Study: One Monitoring Window for Office, Cloud and Kubernetes Servers
Seven servers in the office, a data center, AWS and Kubernetes in one Grafana window: metrics, logs and Telegram alerts for a logistics company in two days.
A logistics company ran its business on seven servers in four different places — and found out about problems the hard way: from customers, from warehouse staff, or by accident. We gave them one monitoring window with all servers and logs, built on Grafana, in two days.
The situation
- Public website and customer portal on rented servers in a data center.
- A new version of the portal running in containers on a two-node Kubernetes cluster.
- Warehouse management backend in AWS — dozens of scheduled jobs: carrier rates, labels, tracking.
- A second cloud server for another site and a test environment.
- A print-and-scales server in the warehouse office (RED Print).
Every server was checked on its own, through a separate login. Logs were read only after something had already gone wrong — and the first signal was usually a customer.
What we did
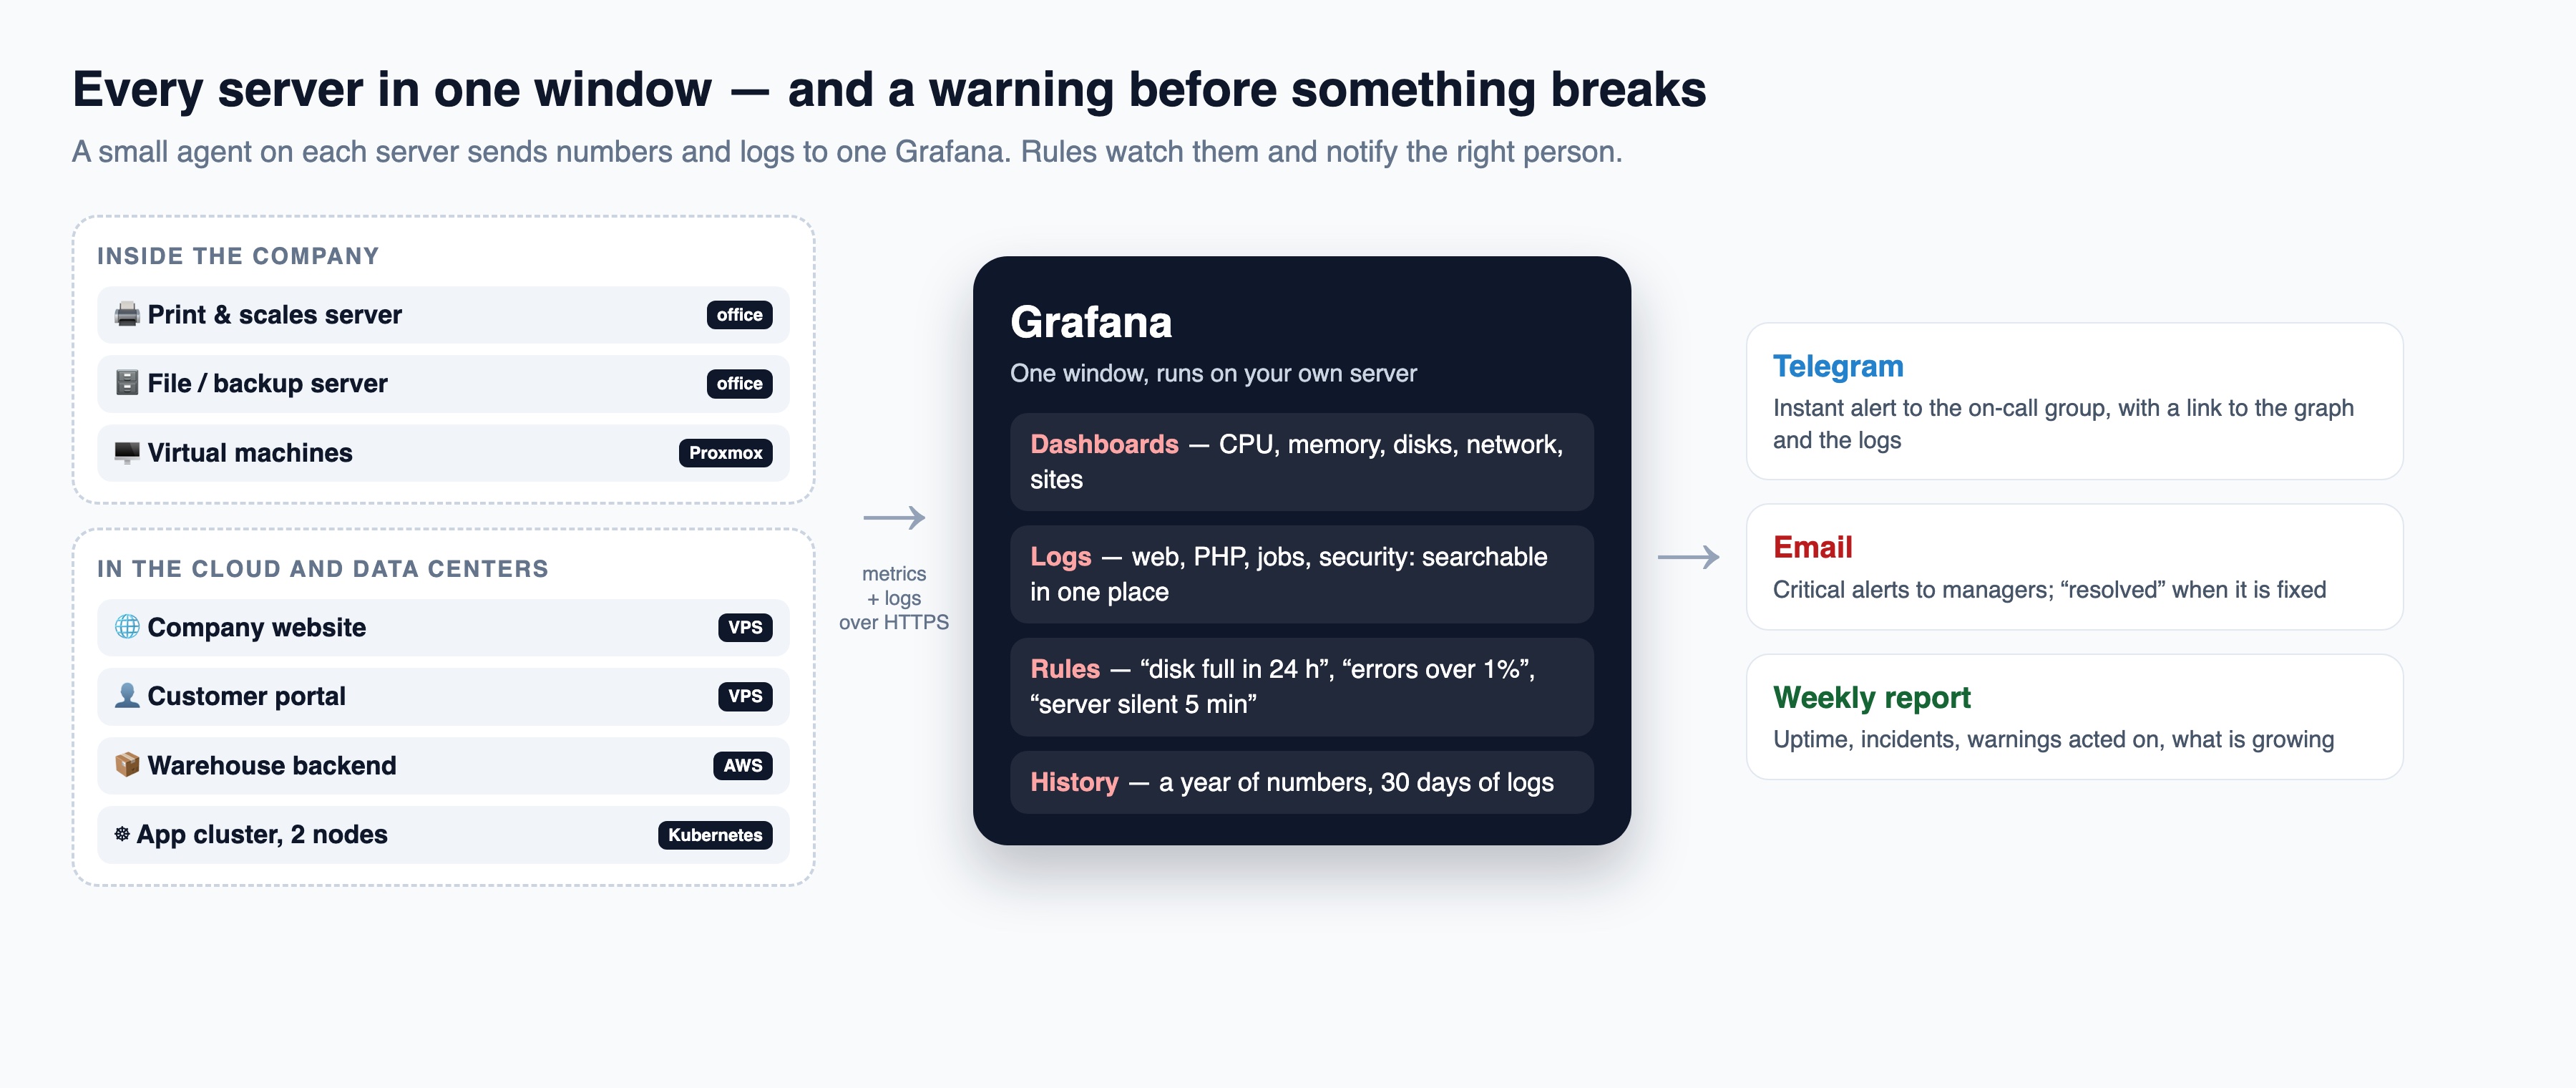
- Monitoring server in the client’s own office — a virtual machine on their existing Proxmox host, so the data never leaves the company.
- One light agent on every server (Grafana Alloy), memory capped so it can never hurt production. It works on new and old systems alike — including a server still on an older Ubuntu release.
- Safe delivery from the cloud: cloud servers send data over encrypted HTTPS with a secret key through a Cloudflare tunnel — no ports opened into the office. The dashboard opens only from the company’s approved addresses.
- Logs that matter, labeled: website requests and errors, PHP errors and slow requests, each scheduled job separately (noisy ones excluded), portal security events, Kubernetes application logs and the system journal.
- Human names: “Website”, “Customer portal”, “Warehouse backend · AWS”, “Print server · office” — instead of IP addresses.
- Storage: a year of metrics, 30 days of logs.
The result
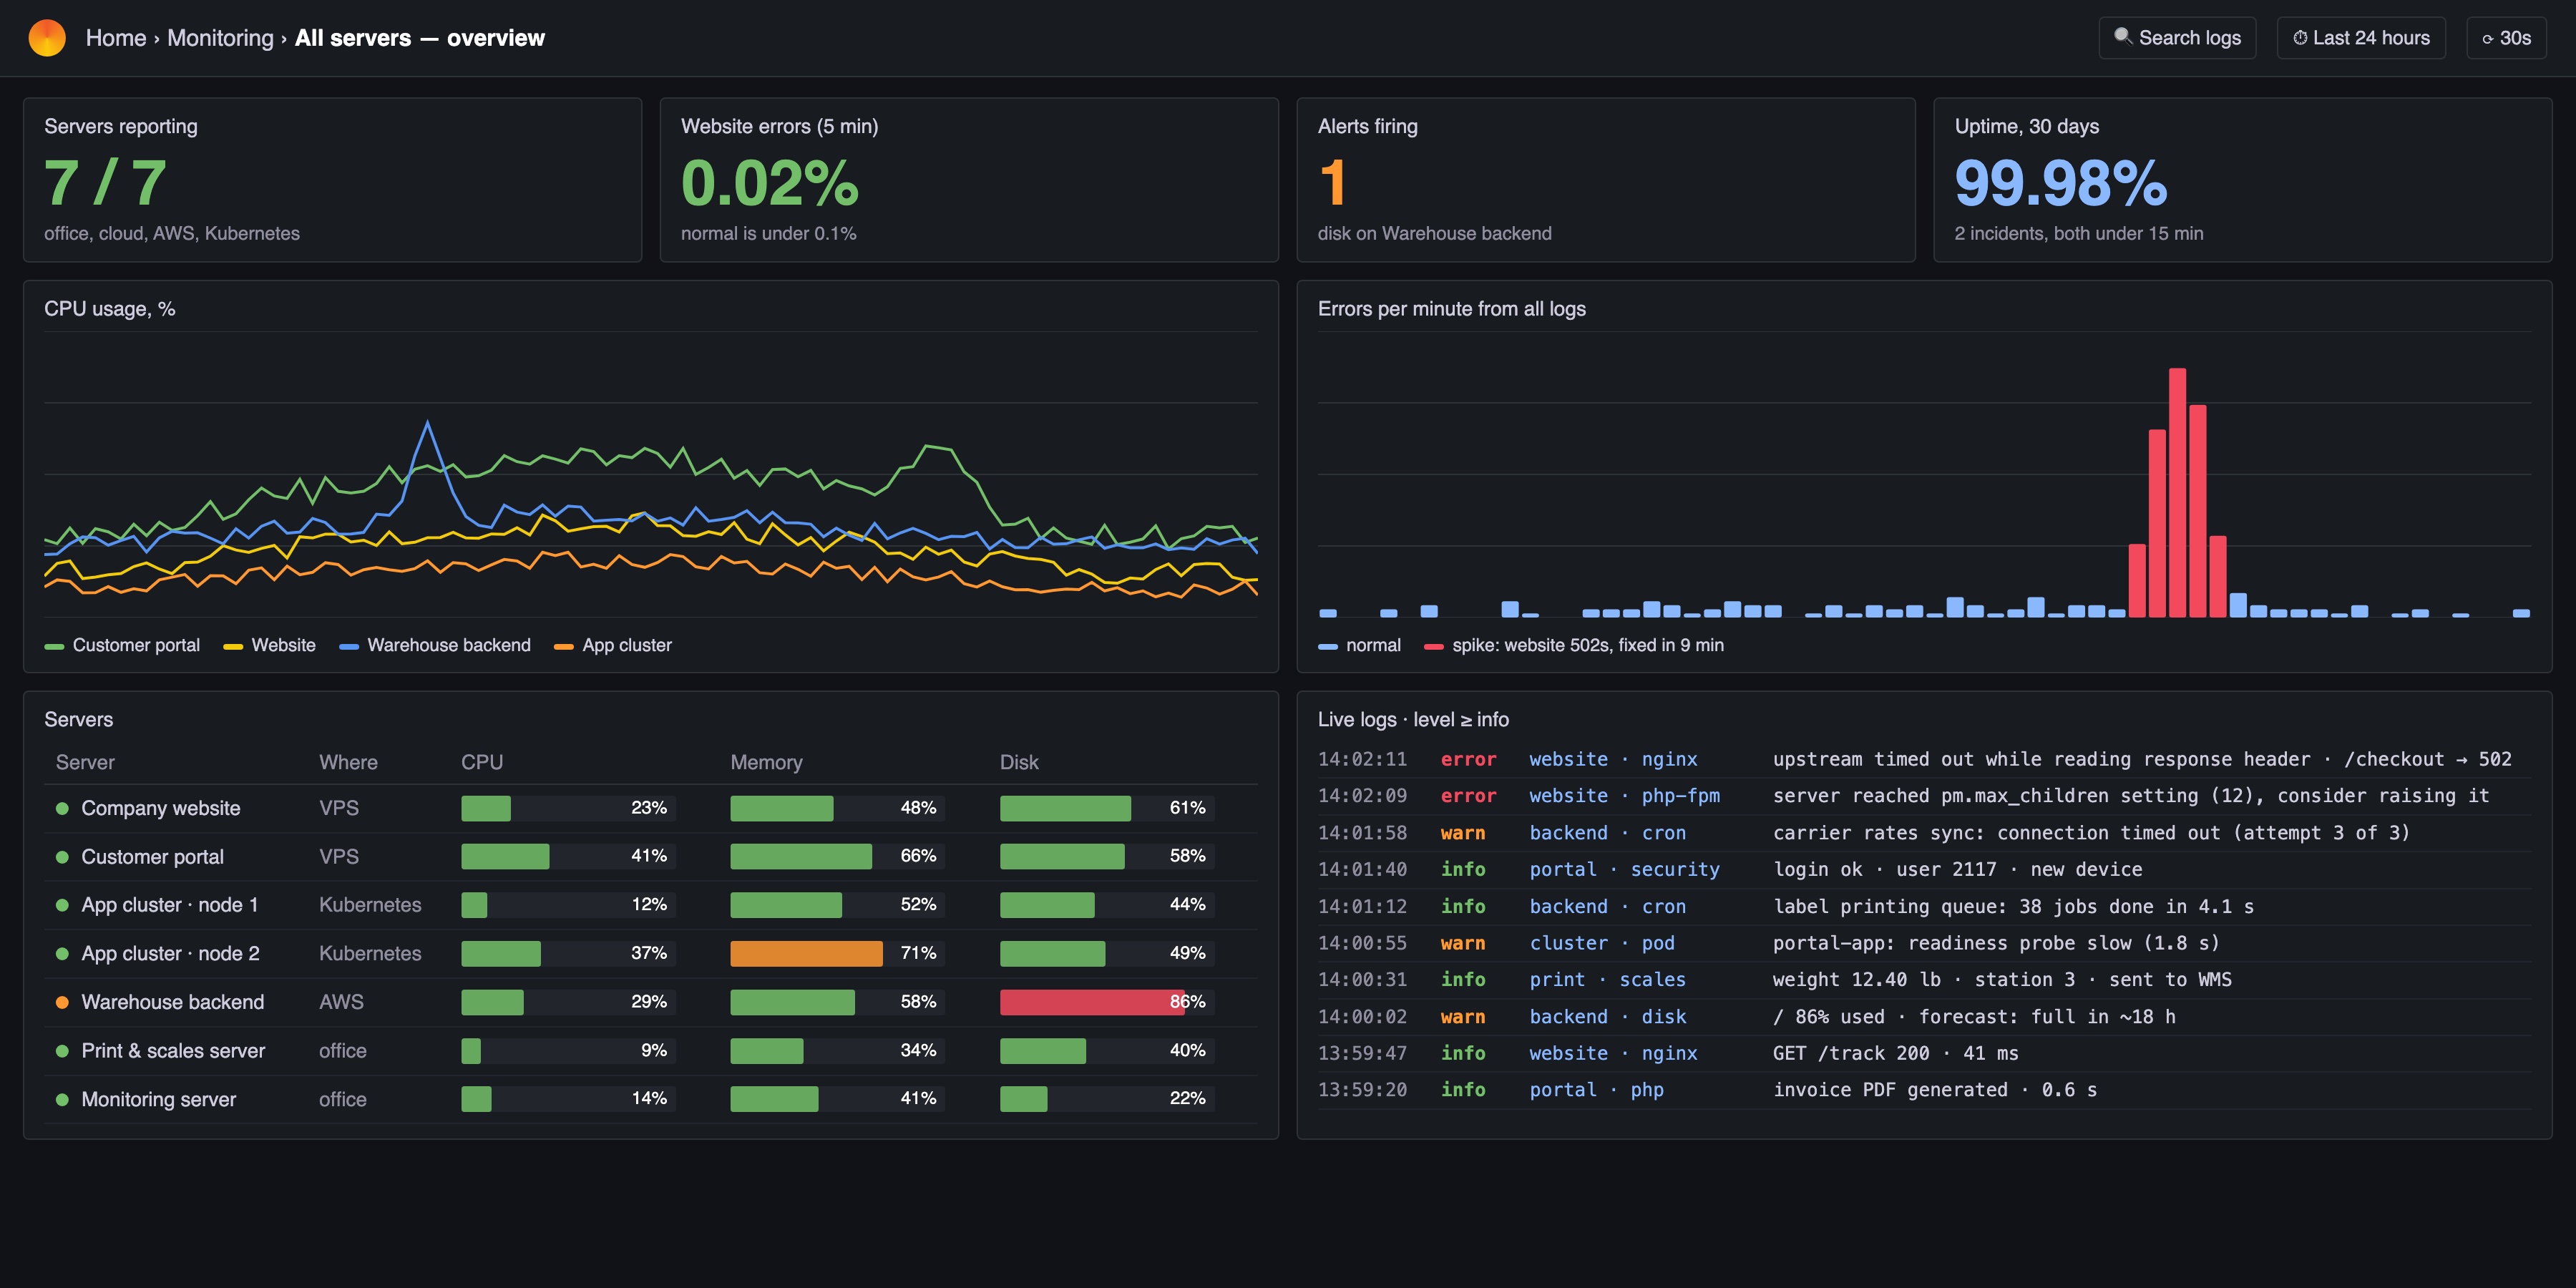
- One window for all seven servers — office, data center, AWS and Kubernetes.
- One search across all logs: “show every error in the last hour” instead of seven logins.
- A year of history: disk growth, peak load and slow periods are visible before they become problems.
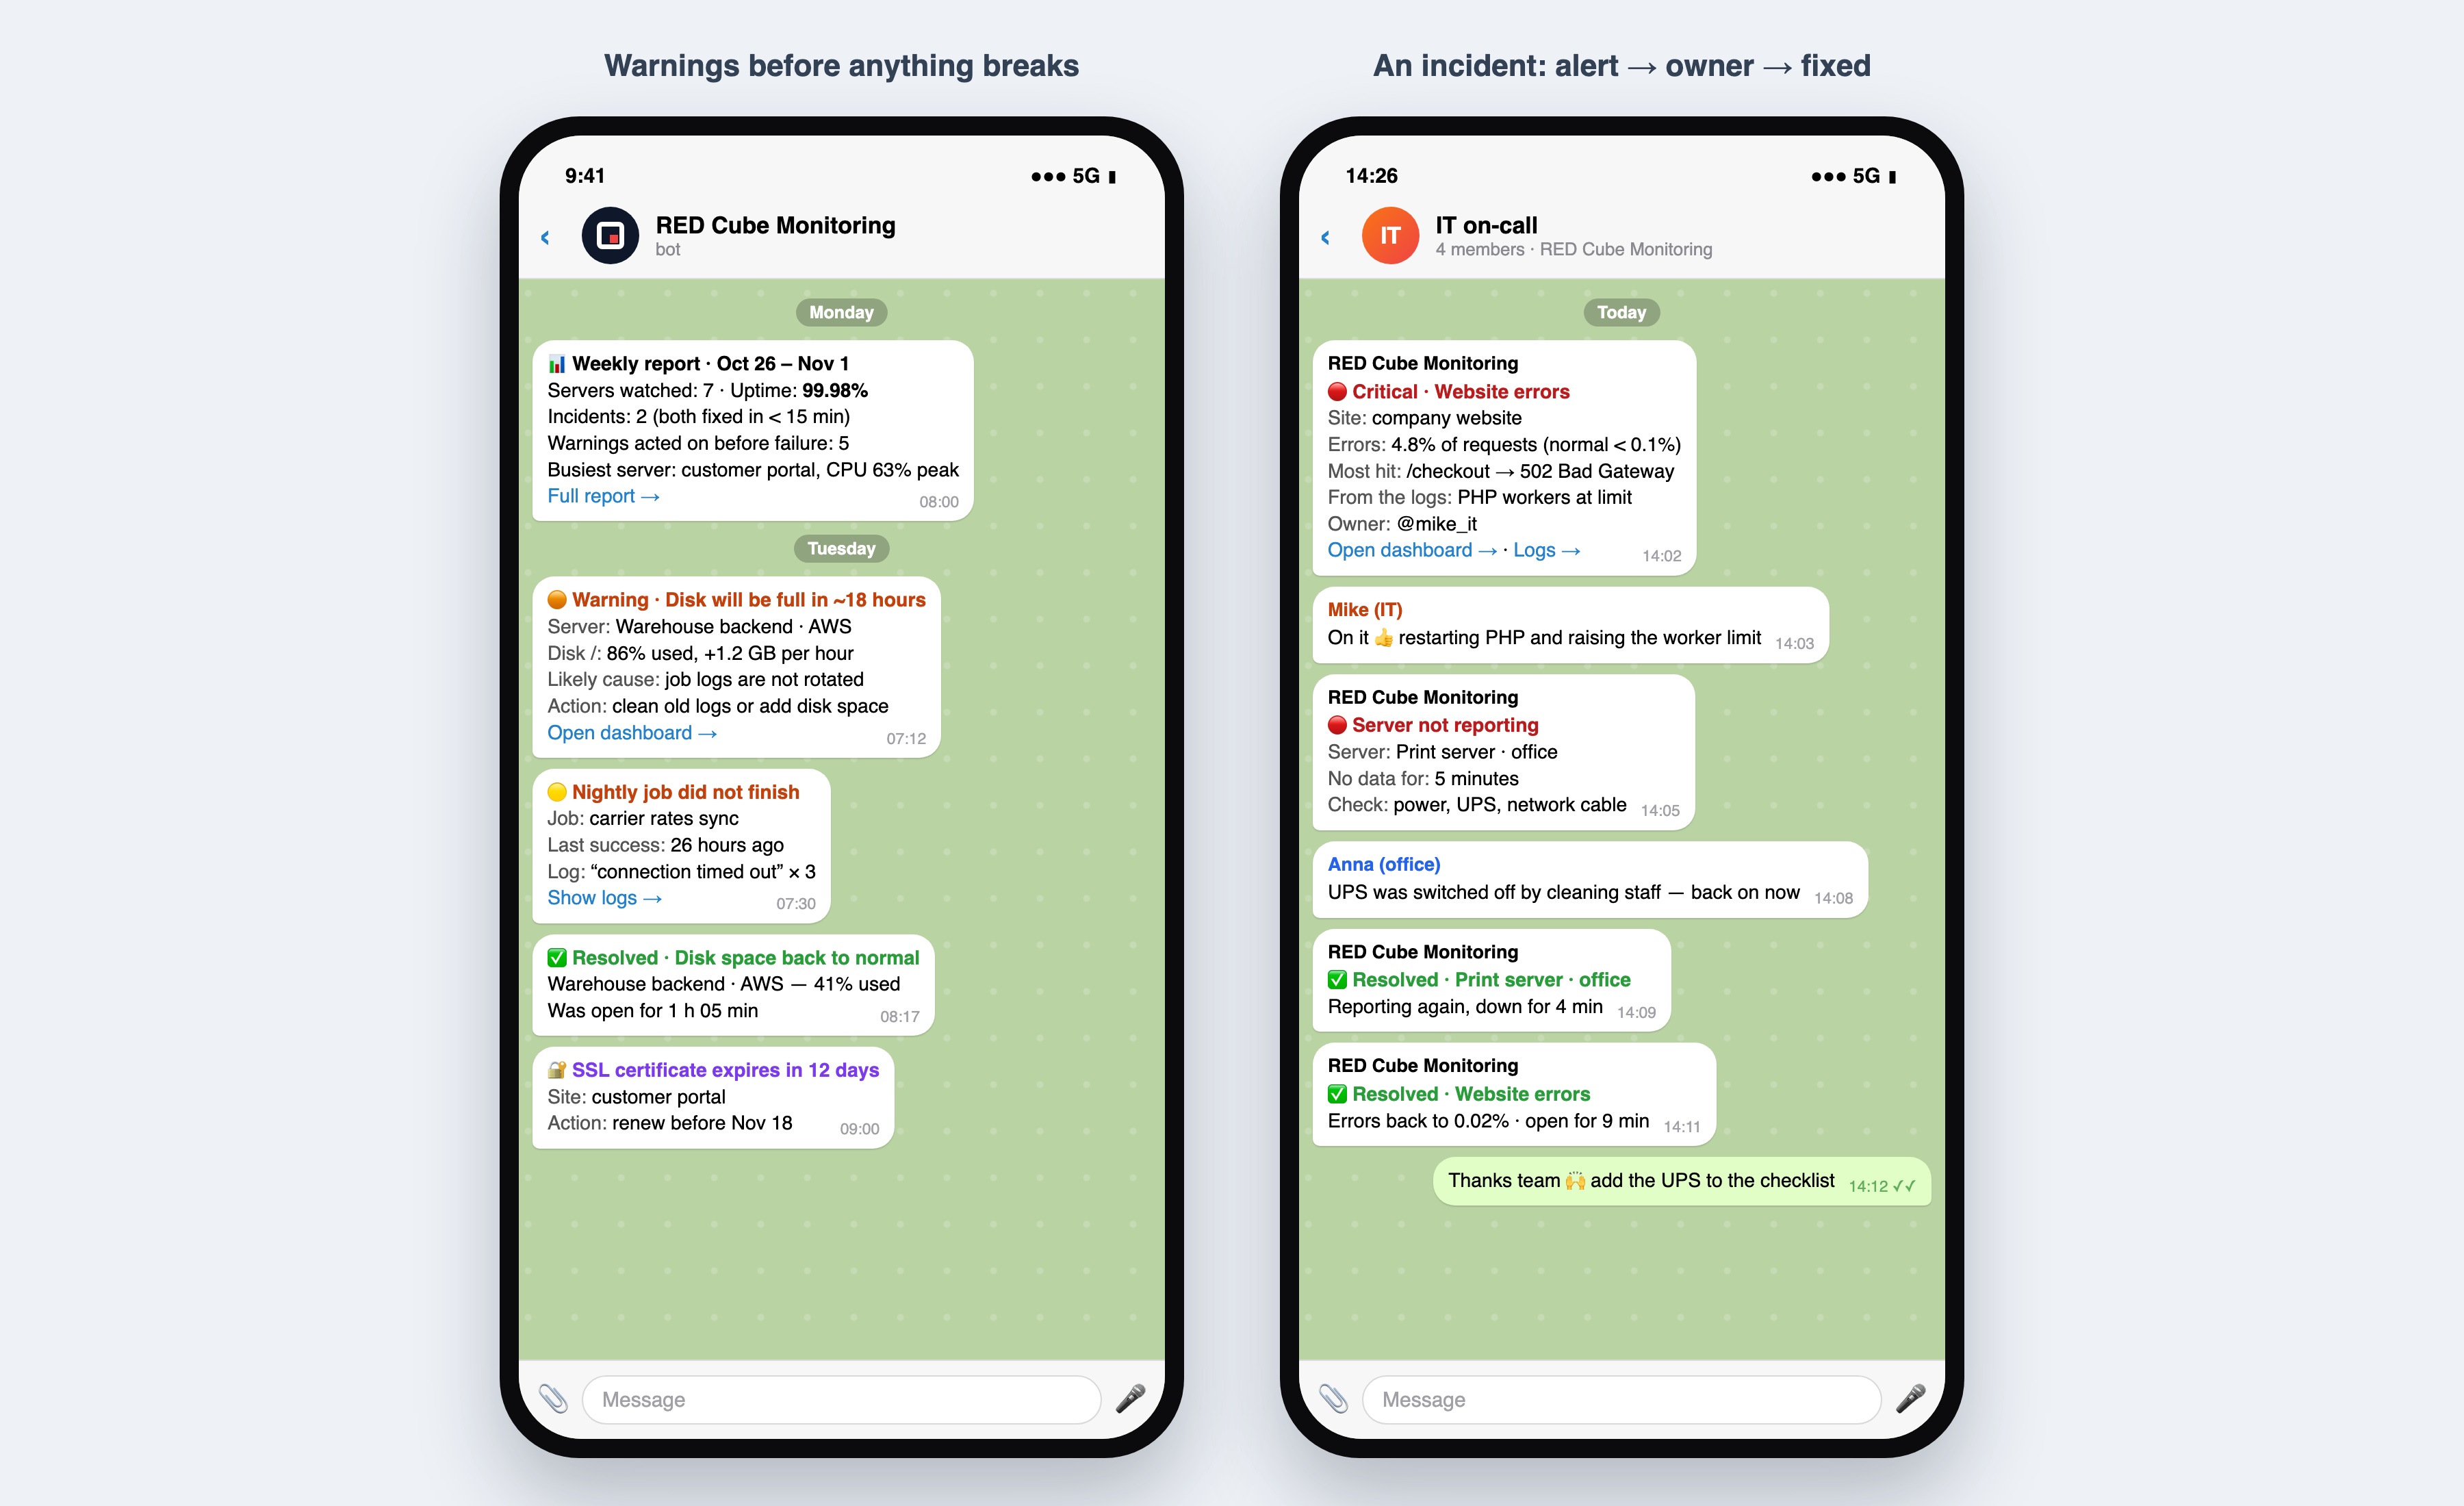
- Ready for alerts: the rules below send messages to the RED Cube Monitoring bot in Telegram and to email, with an owner for each.
Alert rules for this client
- Disk will be full within 24 hours — on every server.
- Server silent for 5 minutes — power, network or hardware.
- Website and portal errors above 1% for 5 minutes.
- A scheduled job in the warehouse backend did not finish or logged errors.
- Repeated failed logins to the portal.
- SSL certificate expiring in 14 days.
Want the same for your company? Read how Grafana monitoring works in plain words, or talk to us.