
Blog · IT Monitoring
Do You Want to Hear About Problems From Your Customers — or Fix Them Before They Notice?
How Grafana puts every server — in your office and in the cloud — in one window, and warns the right person in Telegram or by email before something breaks.
Every business with a website, a customer portal or a server in the back room learns about outages in one of two ways. Either a customer calls — “your site is down”, “I can’t log in”, “the labels aren’t printing” — or your IT team gets a message first and fixes the problem while customers are still happily clicking.
The difference between the two is not luck. It is monitoring: one screen that watches all your servers, reads their logs, and warns the right person before something breaks. The tool we use for this is Grafana. Below we explain, without jargon, what it does and how we set it up for our clients — servers in the office and in the cloud, in one window, with alerts in Telegram and by email.
Two ways to find out something is wrong
| Without monitoring | With Grafana monitoring | |
|---|---|---|
| Who notices first | A customer, by phone or a bad review | Your IT person, in Telegram |
| When | After it has already broken | Hours before — “disk full in ~18 hours” |
| Where to look | Log in to each server one by one | One window for every server |
| Finding the cause | Guessing, digging through log files | All logs searchable in one place, next to the graphs |
| Night and weekend | Found on Monday morning | The on-call person gets the alert |
| For management | “It works, I think” | A weekly report: uptime, incidents, what is growing |
What Grafana is, in plain words
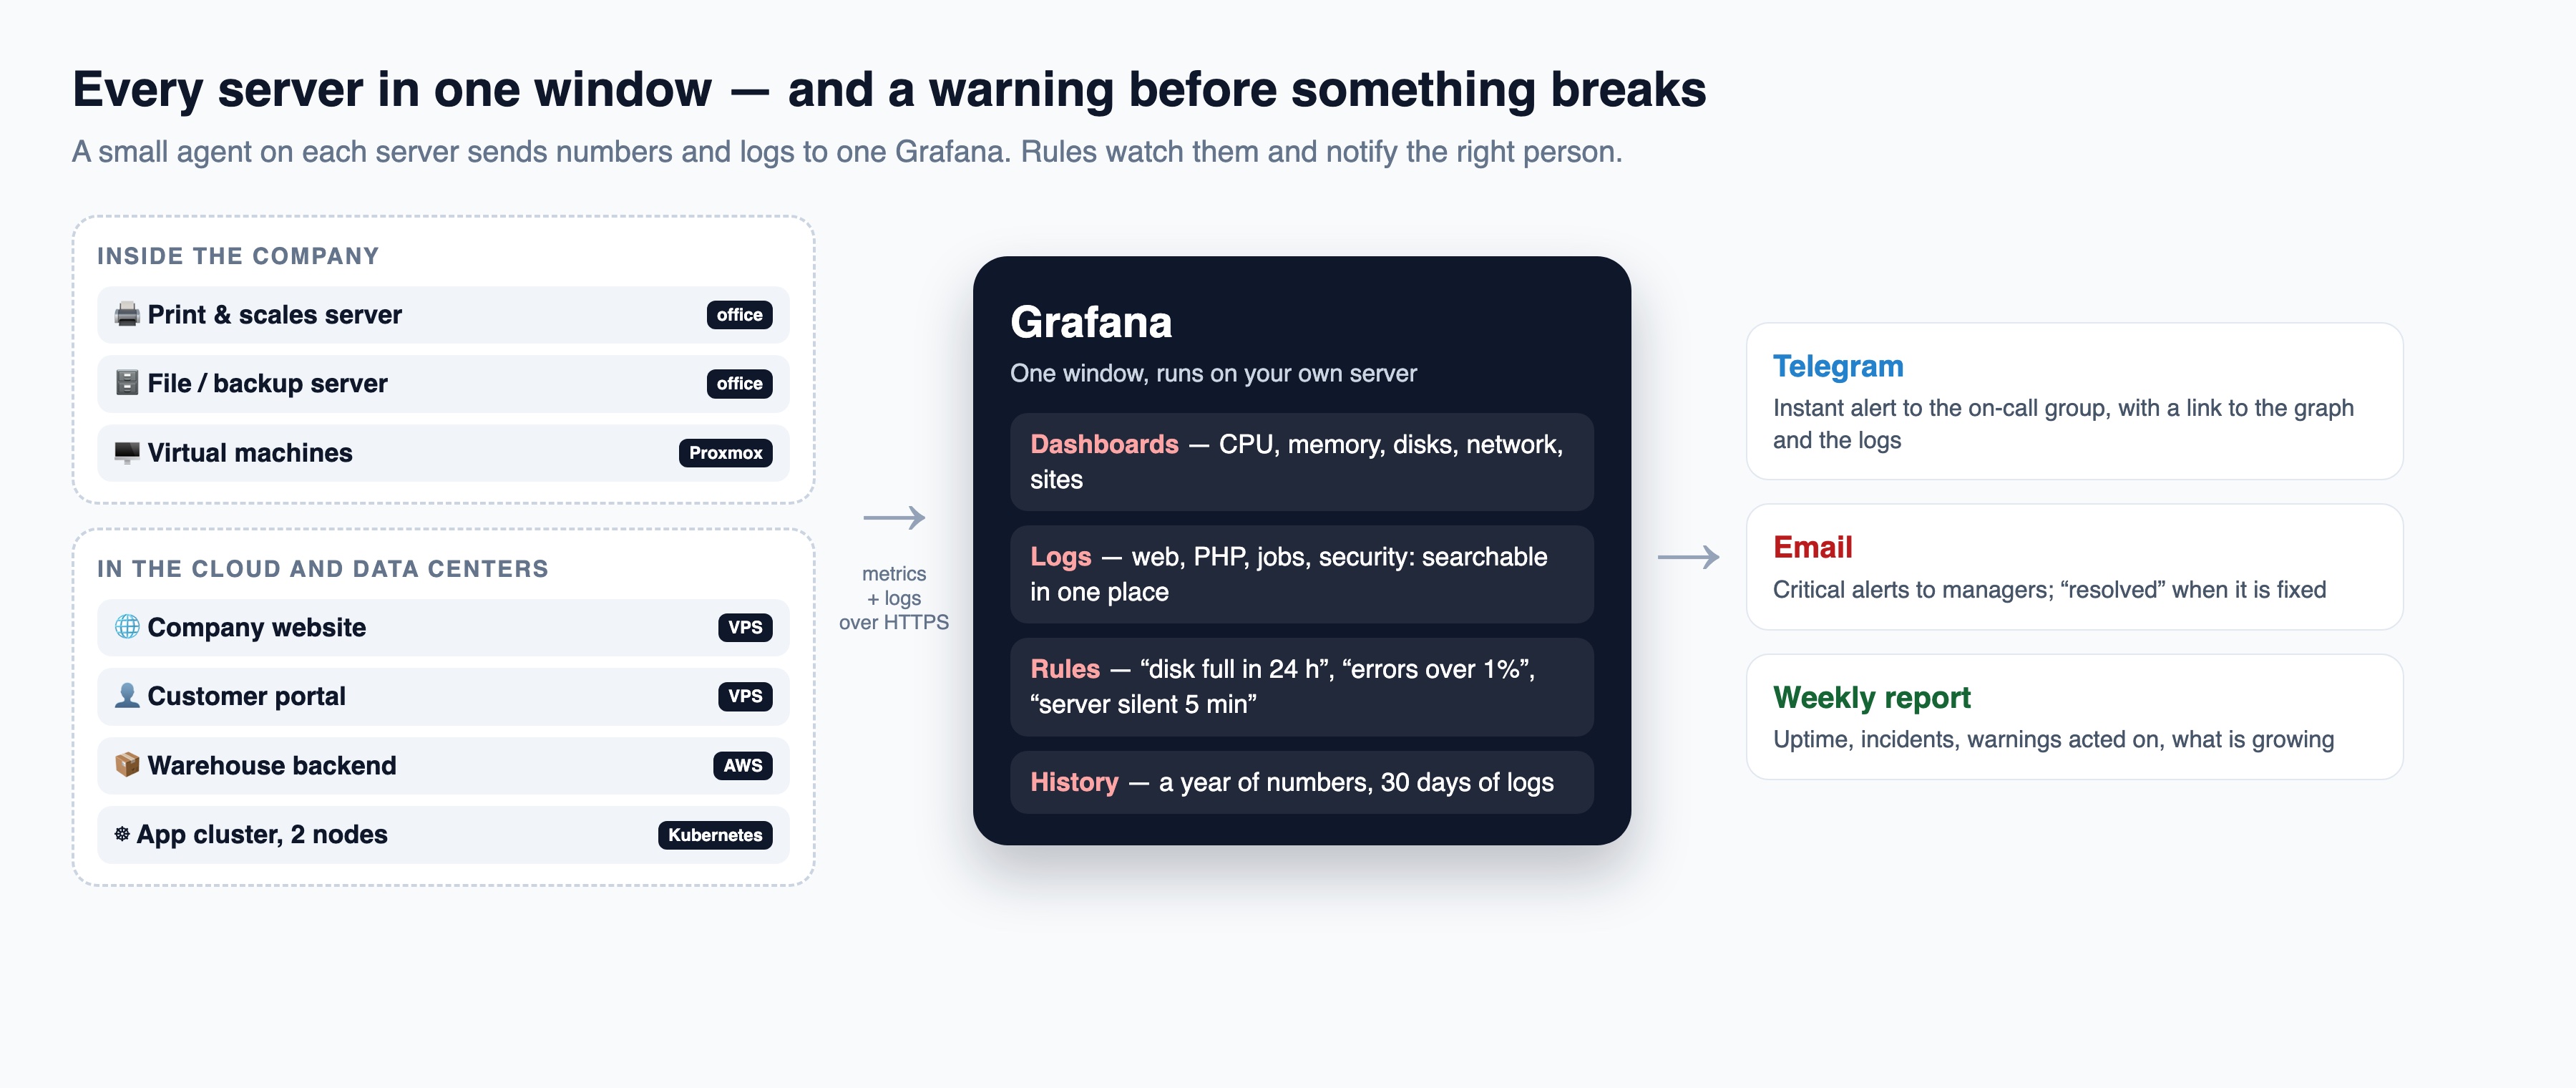
Grafana is free, open-source software for “seeing” your systems. A small program — an agent — runs on each server and sends two things to one central place:
- Numbers (metrics): how busy the processor is, how much memory and disk is used, network traffic, how many website requests fail.
- Logs: the text messages that the website, the database, scheduled jobs and Windows or Linux itself write all day — errors, warnings, logins.
Grafana turns these into dashboards, lets you search all logs at once, and — most importantly — checks rules every minute and sends a notification when a rule fires.
The dashboard: every server on one screen
Instead of logging in to seven servers in four different places, the team opens one page. Green means fine, orange means “look at this soon”, red means “now”.
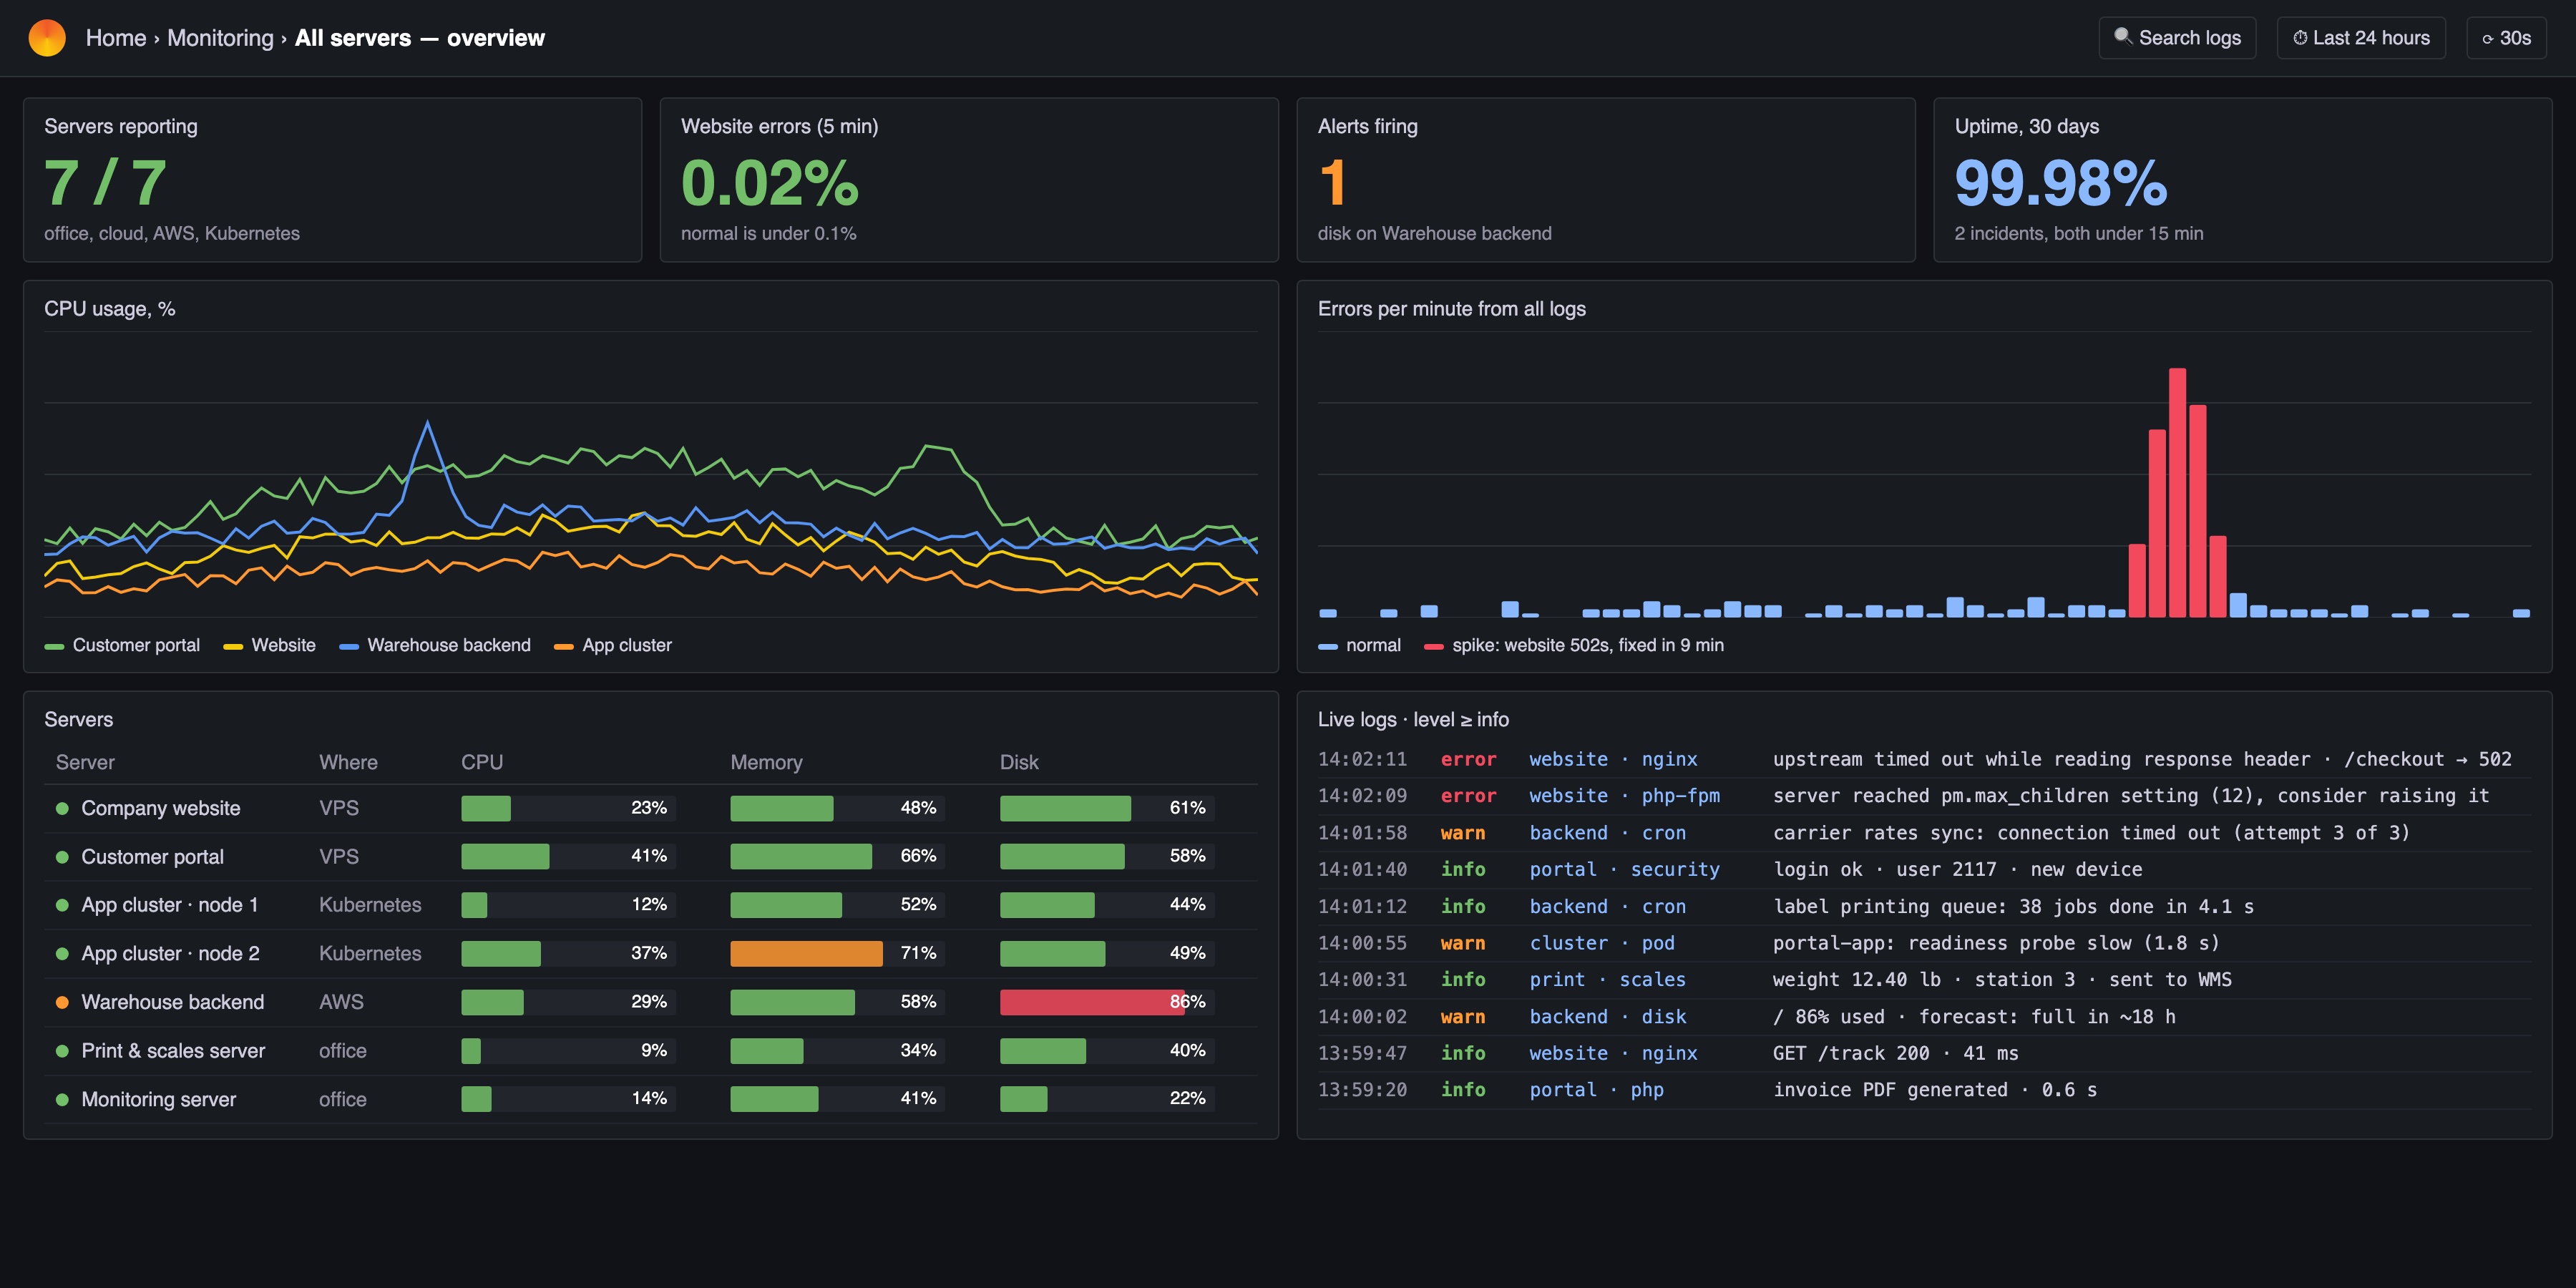
- Top row: are all servers reporting, how many website requests fail, how many alerts are open, uptime for the month.
- Graphs: processor load per server; errors per minute from all logs — a red spike is visible at a glance.
- Server table: CPU, memory and disk for every machine, office or cloud, with colored bars.
- Live logs: the latest important lines from every server, already sorted by level — errors in red.
Any graph can be opened for the last hour, day, week or year — useful when someone asks “was the site slow last Thursday?”
Logs from everywhere, in one search
Logs are where the “why” lives. Normally they are scattered across servers and only read after a problem — if someone knows where to look. With Grafana they are collected in one place for 30 days (or longer, as needed) and searchable like email:
- all website errors in the last hour, across every server;
- every run of a nightly job — did it finish, how long did it take, what did it complain about;
- security events: logins from new devices, repeated failed passwords;
- application logs from cloud containers (Kubernetes) next to the logs of an ordinary office server.
When an alert fires, the message links straight to the logs of that minute — the technician starts with the answer instead of the search.
Triggers: warned before it breaks, not after
A rule (trigger) is a simple sentence: “if this happens for this long — tell this person”. The best rules do not wait for the failure. They look at the trend.
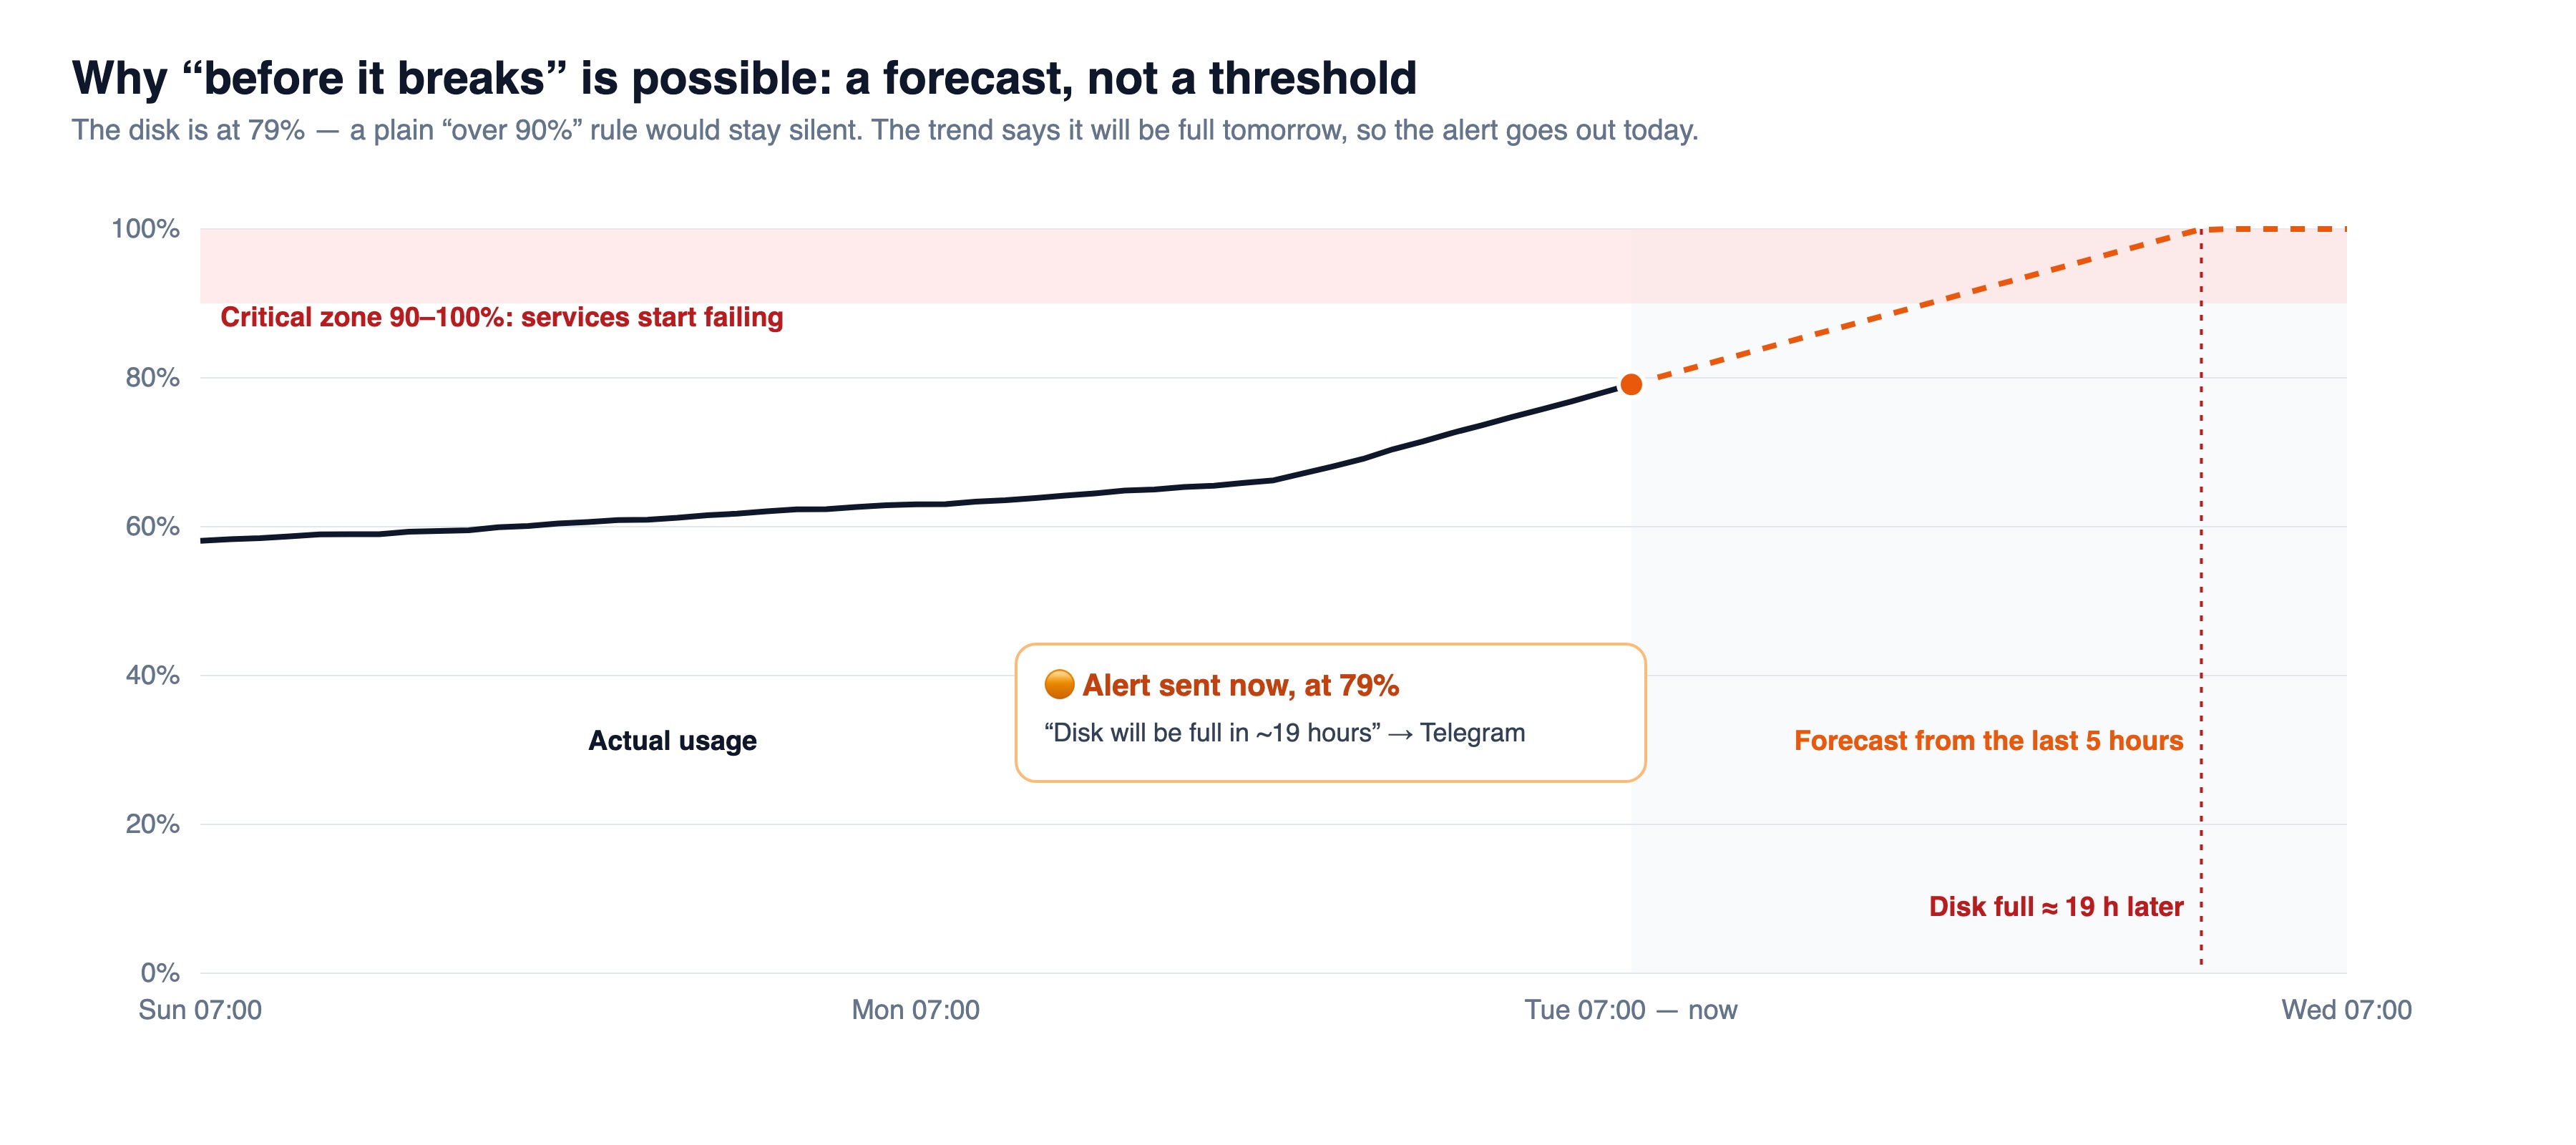
The rules we set up for almost every client:
| Rule | What it prevents | Who gets it |
|---|---|---|
| Disk will be full within 24 hours | Website, database or mail stopping because there is no space | IT on-call, Telegram |
| Server not reporting for 5 minutes | Power, network or hardware failure nobody noticed | IT on-call + office manager |
| Website errors above 1% for 5 minutes | Customers seeing error pages, failed checkouts and logins | IT on-call; email to management if it lasts 15 min |
| Memory or CPU near the limit for 15 minutes | Slow pages, crashes under load | IT, Telegram |
| Nightly job did not finish or logged errors | Missed backups, stale prices, unsent invoices | Owner of that job |
| SSL certificate expires in 14 days | “Not secure” warning in customers’ browsers | IT, email |
| Many failed logins from one address | Password guessing against the portal or remote access | IT and security, Telegram |
We tune the rules during the first week so that every alert means “do something”. A channel that pings ten times a day for nothing gets muted — and then it misses the one alert that matters.
Notifications in Telegram and by email
Alerts go where people actually look. We usually set up a Telegram bot — for example RED Cube Monitoring — plus email for managers:
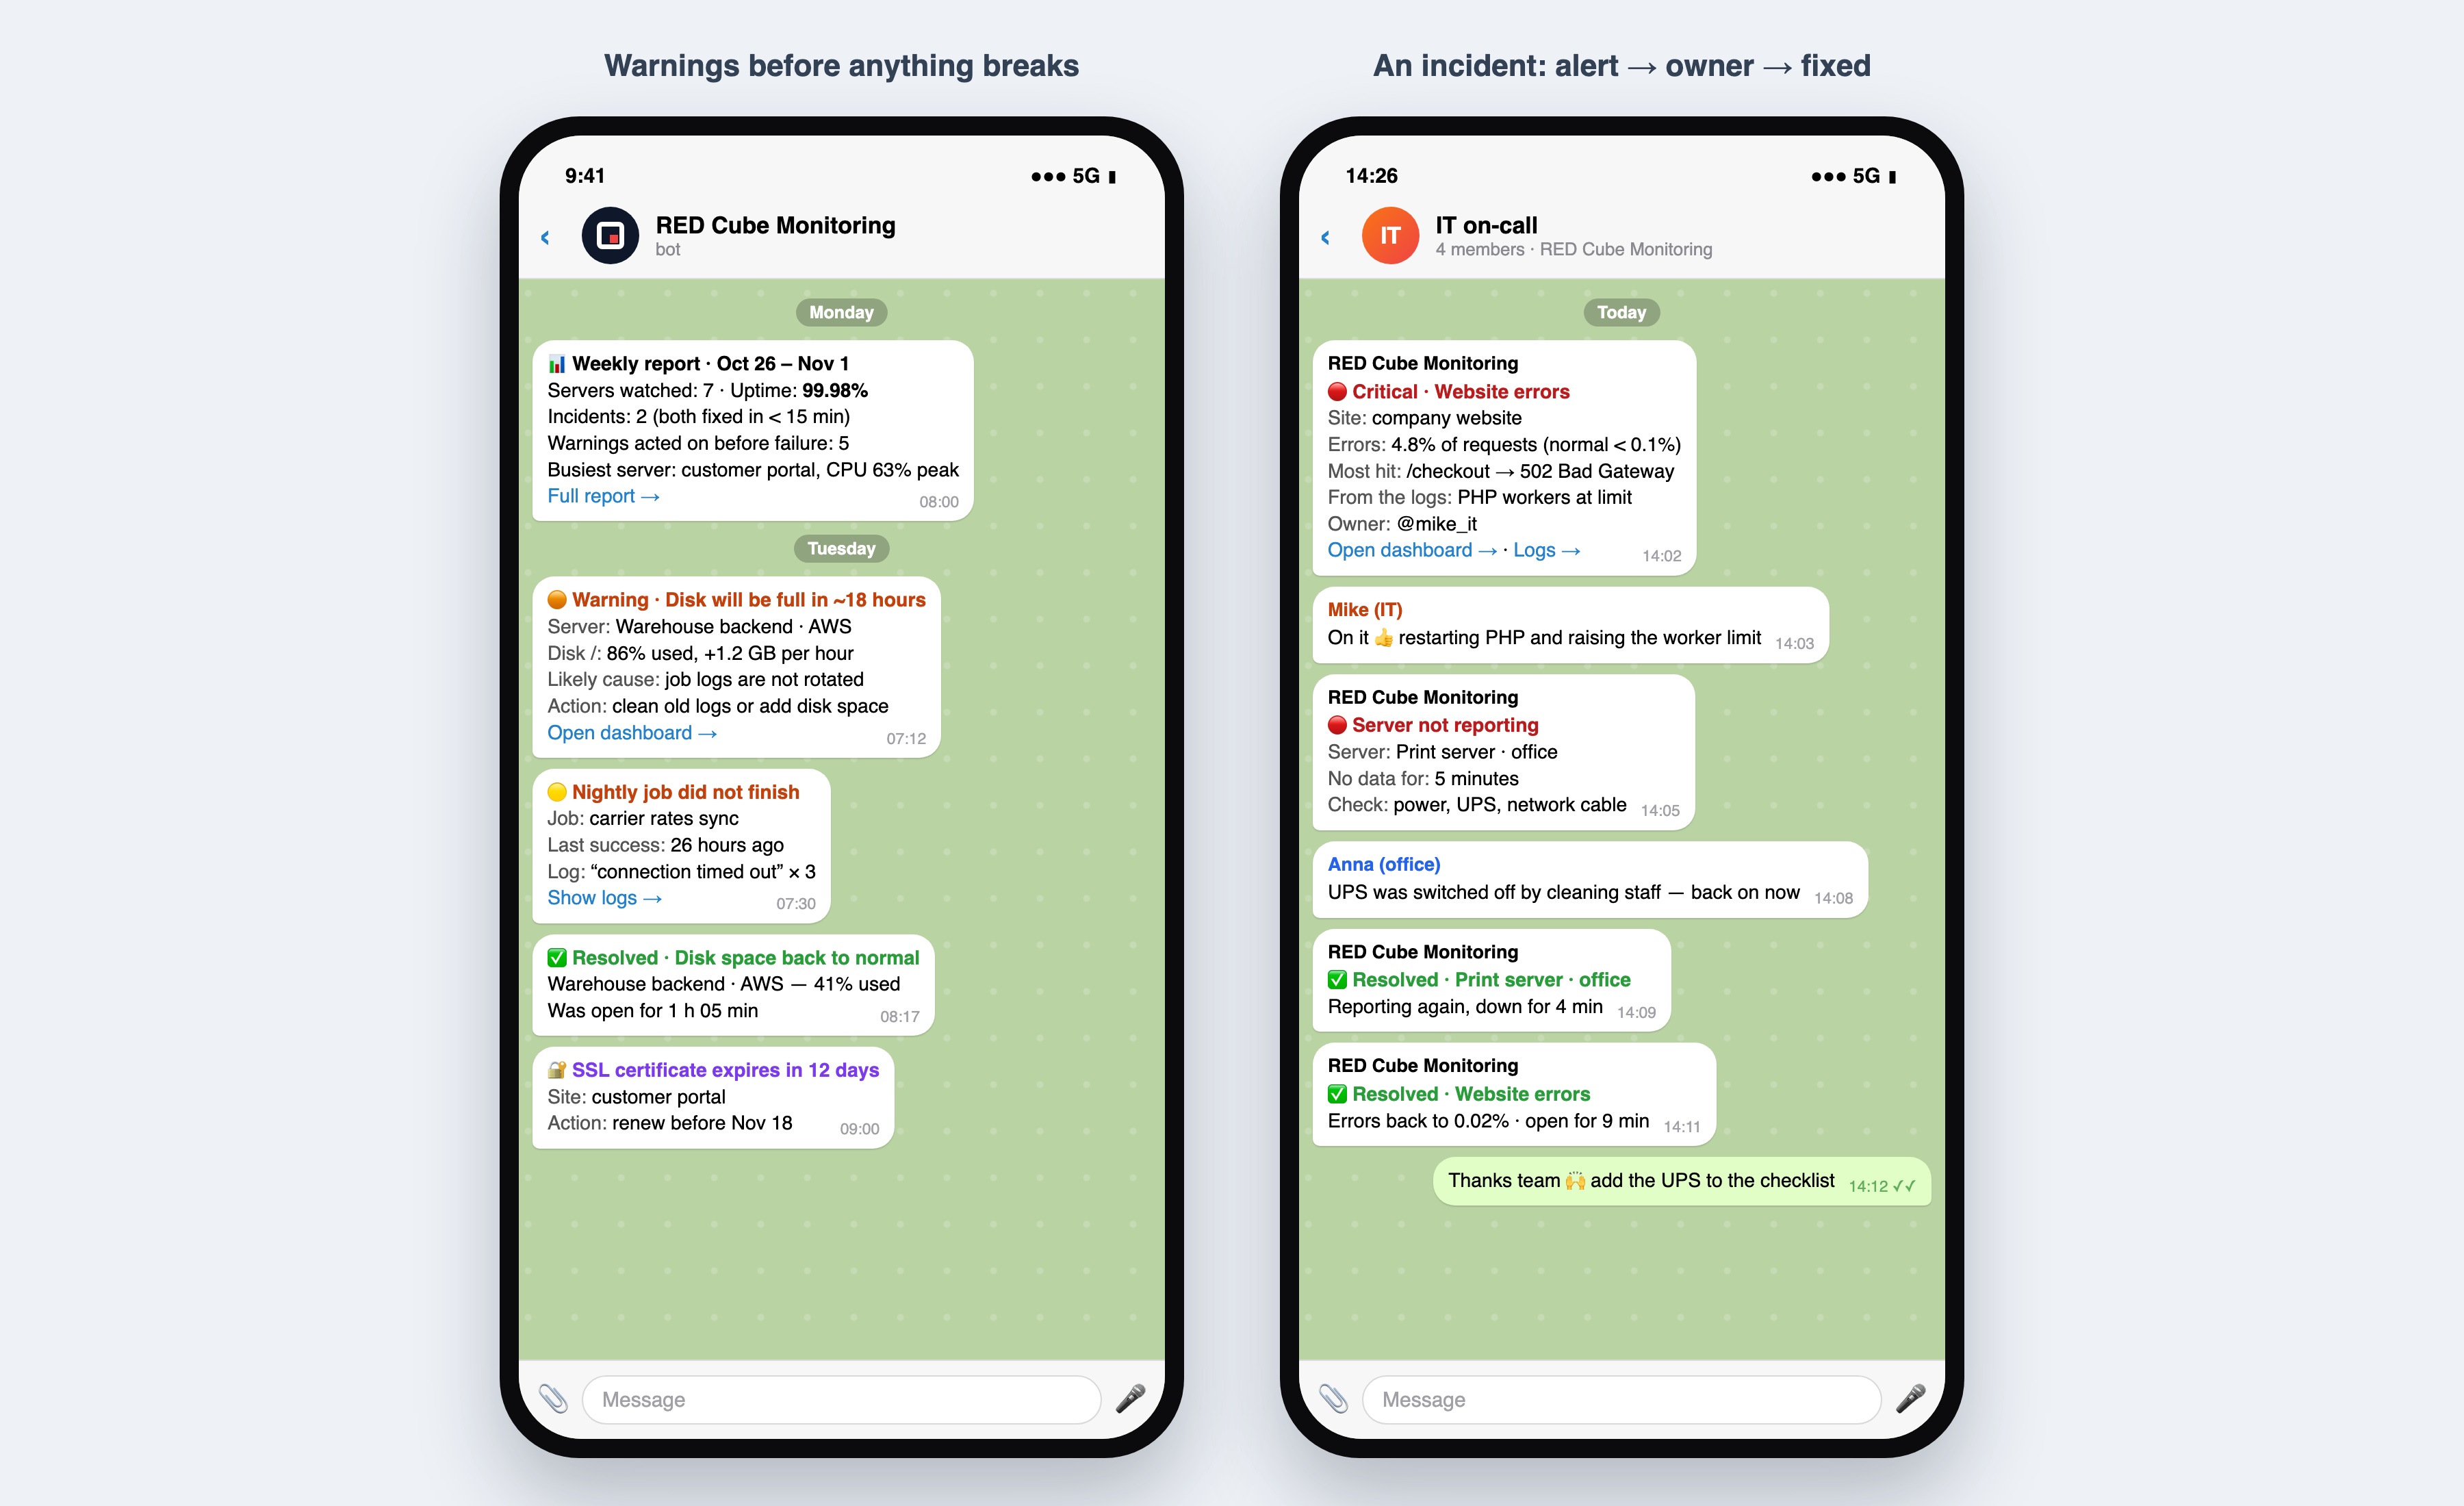
- Each message says what, where, how bad and what to do, with links to the graph and the logs.
- Alerts go to the owner: website problems to the web team, the office print server to the office IT person, backups to whoever is responsible for them.
- Group chat for the on-call team: everyone sees the alert, one person answers “on it”, nobody duplicates work.
- “Resolved” messages: when the problem is gone, a green message closes it, with how long it lasted.
- Escalation: if a critical alert is still open after 15 minutes, an email goes to the manager.
- Quiet hours: warnings wait until morning; only critical alerts wake someone up at night.
Grafana can also send to Microsoft Teams, Slack, SMS services and phone-call services — Telegram and email are simply what most small teams already use.
Reports without extra work
Every Monday the bot (or an email) sends a short summary: servers watched, uptime, incidents and how fast they were fixed, warnings acted on before failure, and what is growing — disks, traffic, memory. It answers the question owners ask most often — “is our IT OK?” — with numbers instead of feelings, and shows early when a server needs an upgrade.
Office servers and the cloud — in one window
Most of our clients have a mix: a server in the office closet (files, printers, scales, a line-of-business app), a website on a rented server, and something in AWS, Azure or Google Cloud. Grafana does not care where a server lives:
- Office servers and virtual machines (Proxmox, VMware, Hyper-V) — Linux and Windows.
- Rented servers and VPS in any data center.
- Cloud — AWS, Azure, Google Cloud — and container platforms like Kubernetes.
- Your data stays with you: Grafana runs on your own server, not in someone else’s cloud.
- Safe by design: agents send data out over encrypted HTTPS with a secret key; no ports are opened into the office; the dashboard is reachable only from your approved addresses.
The agent is light — we cap it at a few hundred megabytes of memory — and it even runs on older systems that are still in production.
A recent project: seven servers, four places, one window
A logistics client had systems spread across the map: the public website and the customer portal on rented servers, a new version of the portal on a two-node Kubernetes cluster, the warehouse management backend in AWS, another cloud server for a second site, and a print-and-scales server in the warehouse office. Each was checked separately, and problems usually surfaced through customers or staff.
In two days we installed Grafana on a virtual machine in the client’s own office, connected all seven servers, collected the logs that matter — website, PHP, scheduled jobs one by one, portal security events, Kubernetes application logs — and gave every server a human name instead of an IP address. Numbers are kept for a year, logs for 30 days.
Grafana or a paid service like Datadog?
Paid monitoring services are excellent and quick to start, but they charge per server and per gigabyte of logs every month, and your data lives on their platform. Grafana is free and open source; you pay for the setup and a small virtual machine, and the data stays on your premises. For a small or mid-size business with 3–30 servers, a well-tuned Grafana does what most teams need from a paid service.
How we set it up
- Inventory: which servers, sites and jobs matter, and who is responsible for each.
- Monitoring server: a small virtual machine in your office or your cloud.
- Agents: installed on every server — usually without downtime.
- Dashboards: an overview for everyone, details for IT.
- Rules and owners: who gets what, in Telegram and by email, day and night.
- A quiet first week: we tune thresholds until every alert is worth reading.
- Weekly report and ongoing care as part of managed IT services.
Frequently asked questions
What is Grafana used for? +
Grafana shows the health of your servers, websites and applications on dashboards, collects their logs in one searchable place, and sends alerts when something goes wrong — or is about to.
Can Grafana send alerts to Telegram? +
Yes. Telegram is one of Grafana’s built-in notification channels, along with email, Microsoft Teams, Slack, webhooks and others. Alerts can go to a person or a group chat.
Can it monitor servers in the office and in AWS or Azure at the same time? +
Yes. A small agent on each server sends data to one Grafana, wherever the server is: office, data center, AWS, Azure, Google Cloud or Kubernetes.
How can monitoring warn before a failure? +
Rules look at trends, not only limits. For example, if a disk keeps filling at the current speed, the alert says “full in 18 hours” while it is still at 80%.
Does it slow down our servers? +
No noticeable effect. The agent uses little CPU, and we cap its memory. It sends small batches of data every few seconds.
Is Grafana free? +
The open-source version is free. The cost is the setup, a small server to run it on, and the time to maintain rules — which we include in managed IT support.
Is our data safe? +
Grafana runs on your own server. Data travels over encrypted HTTPS with a secret key, and the dashboard is available only from approved addresses.
Find out about problems before your customers do
We connect your office and cloud servers to one Grafana, set up alerts in Telegram and email, and send you a weekly report.